Large Format Touchscreens
Accounting for numerous factors in an experience to find the best possible experience.
The details below are a synopsis of a large project. Details have been excluded due to confidentiality agreements. I would love the opportunity to talk with you about this in deeper detail and address any questions you might have.
Background & Goals
At the inception of capacitive touch, the rage became customer engagement via a touchscreen like an iPad. And if a handheld touchscreen emanated innovation, a big touch screen must ooze it. As had been done before, leadership made an impulse purchase of 250 large-format touch screens with an expectation that the right content would propel the company forward as a leader in technology and innovation.
Leadership’s vision was that the screens would ATTRACT previously passive branch patrons. Compelled to INTERACT, they would learn of the multitude of service offerings available. Enlightened by the opportunity to enhance their financial acuity, they would CONNECT with a bank representative such as a financial advisor.
Content was rapidly developed on the direction of leadership. And although it looked sharp, interaction with the touch screens languished. My job was to figure out how to make the experience as effective as possible.
ATTRACT
INTERACT
CONNECT

Along with the leadership team, I developed a list of questions that needed to be answered:
-
What type of content was most appealing, thereby attracting traffic?
-
How long could we expect to keep a person engaged?
-
Did customers understand that this new technology was for them?
-
Where was the best place to position a screen that would drive interaction?
-
What was the optimal performance to be expected from this experience?
Methodology
A Design of Experiments methodology was selected. Design of Experiments (DoE) is a structured approach for collecting data when it is necessary to study the relationship between multiple inputs (Factors) and key outputs (Responses).
A DoE is used to:
-
determine how/if a factor, or collection of factors, effects a response
-
determine how/if factors interact in their effect on the response
-
model the behaviors of the response as a function of the factors
-
optimize responses

Input variables, settings and responses for the DoE
The factors selected for this DoE included:
-
Sign Placement:
-
High traffic areas where people frequently walked by on their way to complete a banking task
-
Waiting areas where people tended to sit idle for extended periods waiting for bank staff
-
-
Awareness:
-
Static, print signage inviting people to interact with the screen
-
Dynamic video content that alerted people to the interactive nature and invited them to engage
-
-
Content:
-
Game-themed content that challenged visitors to achieve a savings goal in order to win a spot on a leader-board
-
Aspirational-themed content encouraging visitors to create a vision board of their financial future
-
Product-themed content that reinforced the value of several bank products and services.
-

Final Design of Experiments for touch screens
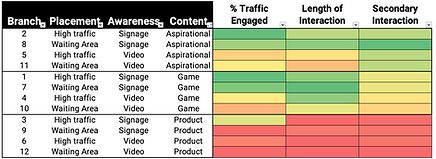
12 branches were identified across the country that were similar in traffic size, customer type and layout. Each of the branches then had a touch screen installed that aligned with the factors in the test. Data was collected and analyzed after eight weeks.
It was equally important to understand WHY people were interacting as they were. To round out the statistical data, intercept interviews were conducted in 6 of the locations.
Insights
-
The static signage was a significant contributing factor to driving engagement.
-
During intercept interviews, it was uncovered that visitors weren't familiar with the technology and assumed it was video content and not interactive.

Performance sorted by awareness type.
-
Game-themed content had slightly more impact in overall engagement, but less success in driving secondary interactions.
-
Aspirational-themed content with a direct call to action to speak with an advisor drove the most secondary interaction.
-
Across all factors, product-themed content was least compelling.
-
The intercept interviews revealed that people felt product information could be obtained online, via personal devices, and was of little interest in a large format screen.
-

Performance sorted by content theme.
-
The experience saw slightly higher use in high traffic areas.
-
This was due to a combination of more possible interactions and less concern that their actions were being monitored by others in the area.
-
-
When the content was engaging, the length of the interaction increased significantly.
-
Data helped identify a threshold of a minimum of 30 and maximum of 60 second experience.

Performance sorted by placement.
Research impacts
Upon synthesis of the results, the team came back to leadership with a recommended strategy for implementation as well as a performance target to serve as a barometer for success. When optimized to perform against the three key outputs of % of traffic engaged, length of interaction and % of secondary interactions, the winning combination was:
Aspirational-themed content
Accompanied by static signage
Placed in high-traffic areas
With content, placement and signage optimized, they could reasonably expect the following performance.
ATTRACT
INTERACT
CONNECT

Armed with this information, the program managers calculated the cost per interaction and determined that the costs did not justify the rewards and cancelled the program. The cancellation of this program saved the company an estimate $25MM that was reallocated to marketing programs with a greater cost/benefit.